Green Street's 2019 Sector Outlooks: Industrial and Retail Trends Beyond Ecommerce
 Industrial Sector Supply Surprises
Commercial real estate valuation and fundamentals have varied across sectors but overall have moved in line with economic growth. However, the industrial sector continues to surprise to the upside with rent and property value growth outpacing other major property sectors. The primary driver of the outperformance has been the disproportionate amount of warehouse space required to meet consumer demand for goods. Industrial demand further benefitted from the modest boost to the economy from corporate tax cuts enacted at the beginning of 2018. Industrial valuations have also been buffered by a tempered level of new construction because of rising regulatory barriers in locations where warehouse demand is most robust.
Rising Obstacles to Development
Despite attractive returns to industrial real estate owners in recent years and the subsequent high demand for industrial real estate, new supply in 2018 was lower than the prior year. The limited new supply relative to tenant and investor demand can largely be attributed to the challenges facing new development, which include cumbersome entitlements, rising labor and land costs, and less availability in sought after locations. The entitlement process has been more challenging this cycle as demand has shifted toward population-dense locations. There is significantly greater difficulty in accessing suitable urban sites for development today, and those come with higher land values.
 Source: Local Market Sources, Green Street Advisors
Cities are also more discerning about industrial development and are forcing developers to fund supporting transportation infrastructure. Green Street expects supply-demand imbalances to continue and for those to translate into inflation-beating market rent growth in numerous markets. Non-coastal markets are expected to receive the highest levels of new supply over the next five years.
Supply Correlation with Regulation
The industrial sector has historically been saddled with concern of tempered growth in rents due to fast development cycles and substitutional locations for tenants across and within all markets. In the prior cycle, there was no correlation between rent growth and difficulty of development, as measured by Green Street’s Regulatory Barrier Scores. In this cycle however, closer proximity to larger populations has become more critical in order to access a bigger labor pool, reduce transportation costs, and adapt to the rapid delivery times mandated by ecommerce. Lead industrial analyst Eric Frankel finds a new relationship emerging and a much stronger correlation between markets with rent growth and meaningful regulatory barriers. This trend has been more pronounced in coastal markets where access to large sites has proven especially difficult.
Download the complimentary report, Supply Has Been the Real Surprise, to explore these industrial real estate topics further. Beyond supply trends, Green Street’s 2019 U.S. Industrial Outlook covers risks, demand drivers, operating fundamentals, capital expenditures, transaction and financing markets, and relative valuation. Contact Us for more information on the outlooks and Green Street’s Real Estate Analytics research offering.
Strip Center Shadow Supply Creeping
While ecommerce has been a boon to the industrial sector, it has created upheaval in the retail real estate market, which is saddled with tired big box concepts and a need to rethink brick-and-mortar location strategies. Many key strip center tenants – particularly the larger ones – are struggling in the current retail environment. Above-normal retailer bankruptcies and store closures should be expected for the foreseeable future, and that presents a significant headwind for sector fundamentals. Although new development should be minimal moving forward, elevated levels of shadow supply (i.e. newly vacant space from retailer store closures) is exacerbating oversupply issues. Occupancy is forecast to decline over the next several years, giving retailers more negotiating leverage and putting pressure on market rents. That said, operating fundamentals at higher-quality centers should fare much better than at lower-end centers in the same market.
Demographics Drive the Bus
Strip centers are local businesses and demographics play a vital part in assessing a property’s long-term growth profile and capitalization rate. Green Street created Trade Area Power (“TAP”) Scores to quantify demand and compare the quality of locations in a singular metric. All things being equal, a higher TAP score equates to higher potential demand. Green Street enhanced its TAP Score methodology with release of the 2019 U.S. Strip Center Outlook. The retail research team expanded Green Street’s Strip Center Database to 20,000+ properties, now including thousands of privately-owned centers as well. Consequently, this allows for more accurate ranking of TAP Scores across the top 50 U.S. markets. According to the Green Street ranking, Bay Area markets and Washington, D.C. possess the highest TAP Scores in the country.
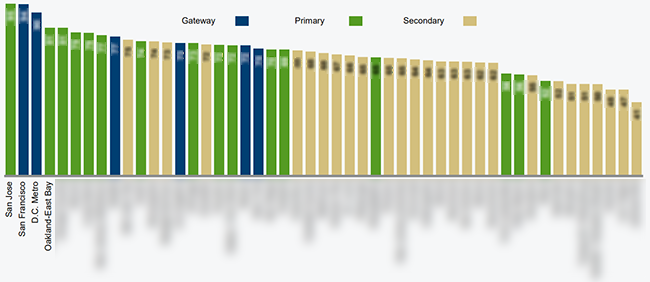 Source: Green Street Advisors
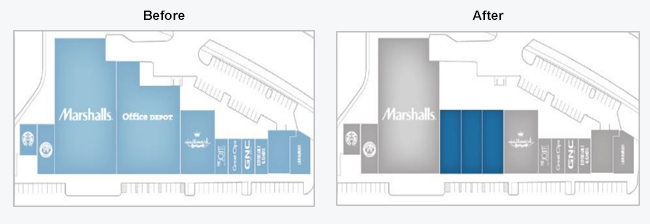
De-Boxing is Not De-Best
Green Street’s retail team conducted a case study of the Sports Authority liquidation and used it as a proxy for estimating how long it takes to backfill large boxes. A minimum of 18 months downtime should be expected when re-tenanting anchor space. Roughly 20% of the REIT-owned Sports Authority spaces were “de-boxed” – meaning the large format floorplate was divided into multiple smaller spaces where tenant demand is stronger and rents per square foot are higher. Not surprisingly, backfilling results were better for centers in strong demographic areas. Centers in weaker demographic areas had to more frequently “de-box,” which generally offers worse unit economics than the original floorplate. Surprisingly, centers in primary markets performed roughly in line with centers in secondary/tertiary markets.
 Lack of Transaction Action
The volume of strip center deals was down by 25% in 2018, falling to its lowest level in five years. Large transactions (i.e. greater than $100 million) are down even further due to a shrinking number of unqualified buyers and seemingly minimal interest from the larger institutions. Most of the deals have been either at the very high end or the low end of the quality spectrum. The dearth of activity in the middle could suggest further upward movement in cap rates for those properties.
View the 2019 U.S. Strip Center Outlook excerpt for an inside look and the Market Snapshot for San Francisco.
Related Resources:
- Report: Industrial Supply Has Been the Real Surprise
- Video: Retail Real Estate Trends and Digitally-Native Brands
- Report: Non-Core Sectors Dominate, There are More than Four Flavors
- Video and information to learn more about Real Estate Analytics
Learn more about our insights
Our thought leadership helps thousands of clients make better investment decisions every day. Inquire here to learn more about Green Street’s product suite.
More Stories
Retail Sector
Deep Dive into Local Data Company: 2023 UK Retail and Leisure Trends Analysis
Video
The Current State of Play and Key Performers in Pan-European Private Markets
Investment Strategy